We created a survey to see what our target audience's preferences and viewing habits would be to help with generating ideas. 217 people responded and the average time to complete it was 6 minutes and 7 seconds.
36 people were 14 or younger
178 were between the ages of 15 and 18
3 people who were 22 or older
95 males
104 females
4 transgender people
7 non-binary people
1 person who identified as other
6 people who preferred not to say
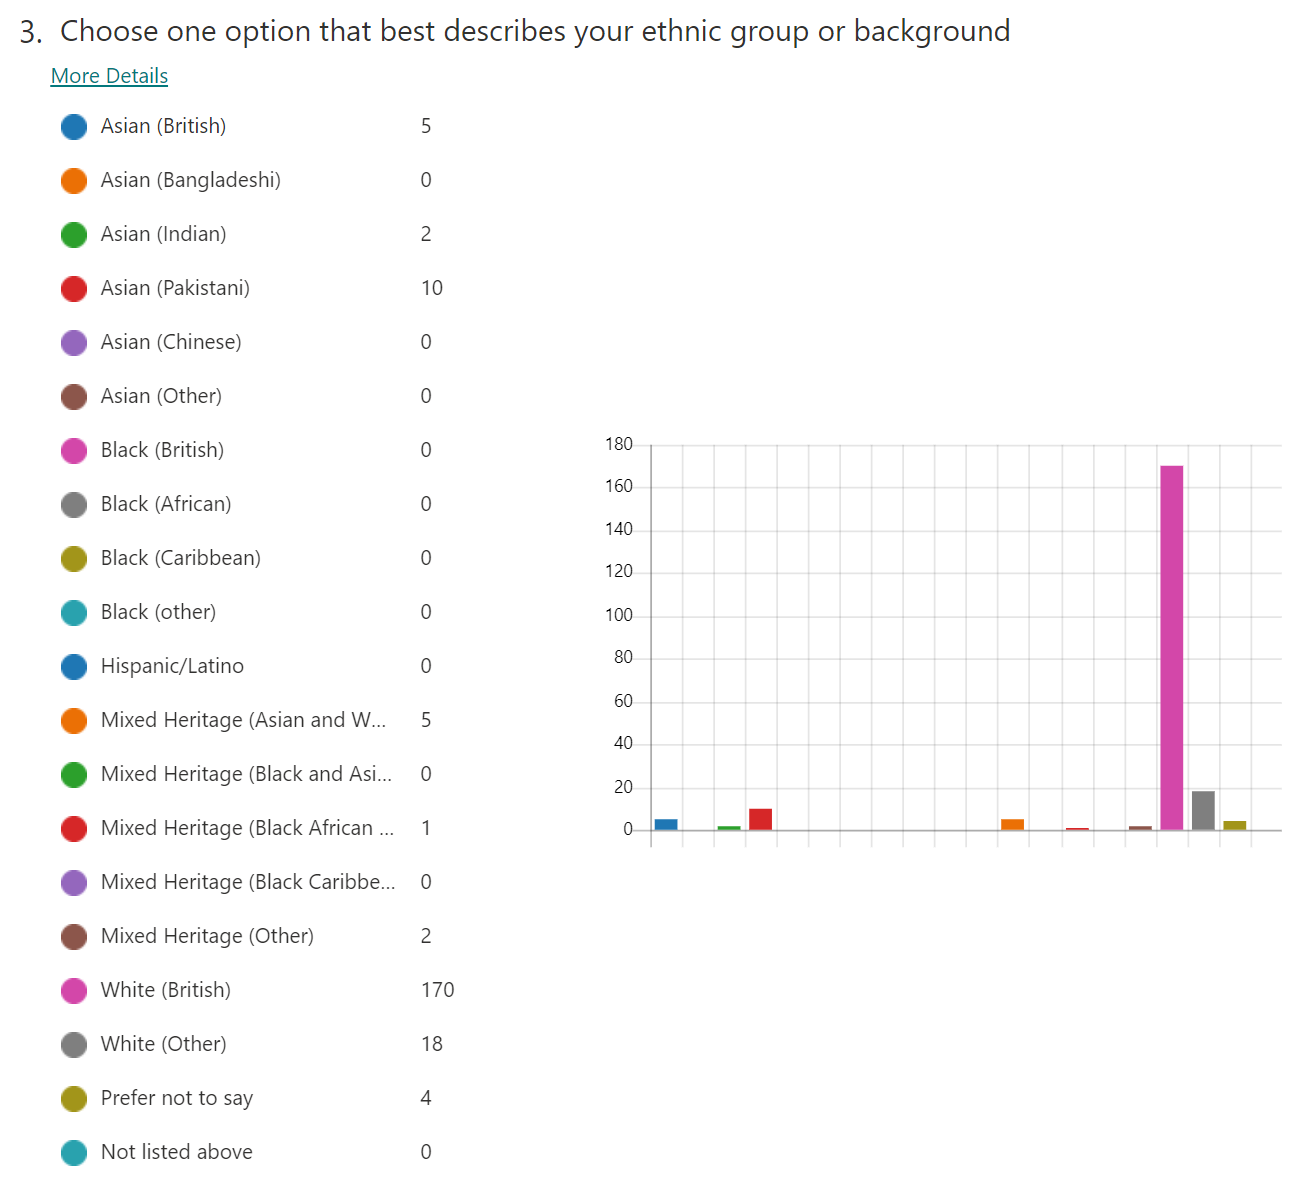
We asked what ethnic background the participants were to allow for more representation. The majority of participants were white (British) at 170 participants, followed by 18 white (other) participants then 10 Pakistani participants and many more ethnic backgrounds. 78% of the participants were white (British), meaning that 22% of the participants belonged to ethnic groups other than white (British), meaning that a big proportion of our audience would be of other ethnic background other than white (British).
We asked what sexual orientation the participants were to further allow for more representation. We found that the majority of participants were heterosexual at 136, followed by 39 bisexual people and 15 homosexual people, 3 asexual people, 8 were unsure, 9 were other and 7 preferred not to say. Showing that a large proportion of the participants were LGBTQIA+ at 34% (excluding those who answered prefer not to say) Therefore, meaning that a large portion of our target audience would be LGBTQIA+.


We asked why they watch TV dramas to get a clearer view on audience pleasures. This showed that the majority watch them to 'escape from reality' at 49% followed by 55 responses to 'connect with characters' (25%). Meaning that I need to create relatable characters and create something which allows people to escape from reality.


No comments:
Post a Comment